AnnaRose will synthesize multiple data points and sources for a holistic look at your impact on students. AnnaRose can use…
MCA
FAST or other reading assessment
Access 2.0
Teacher Assignment
Demographic information to disaggregate
Intervention Assignment
Attendance
Teacher Evaluation
Other data? AnnaRose helps you determine the questions you want the data to answer.
Keep reading to see how proficiency shifts can reveal a lot about your impact…
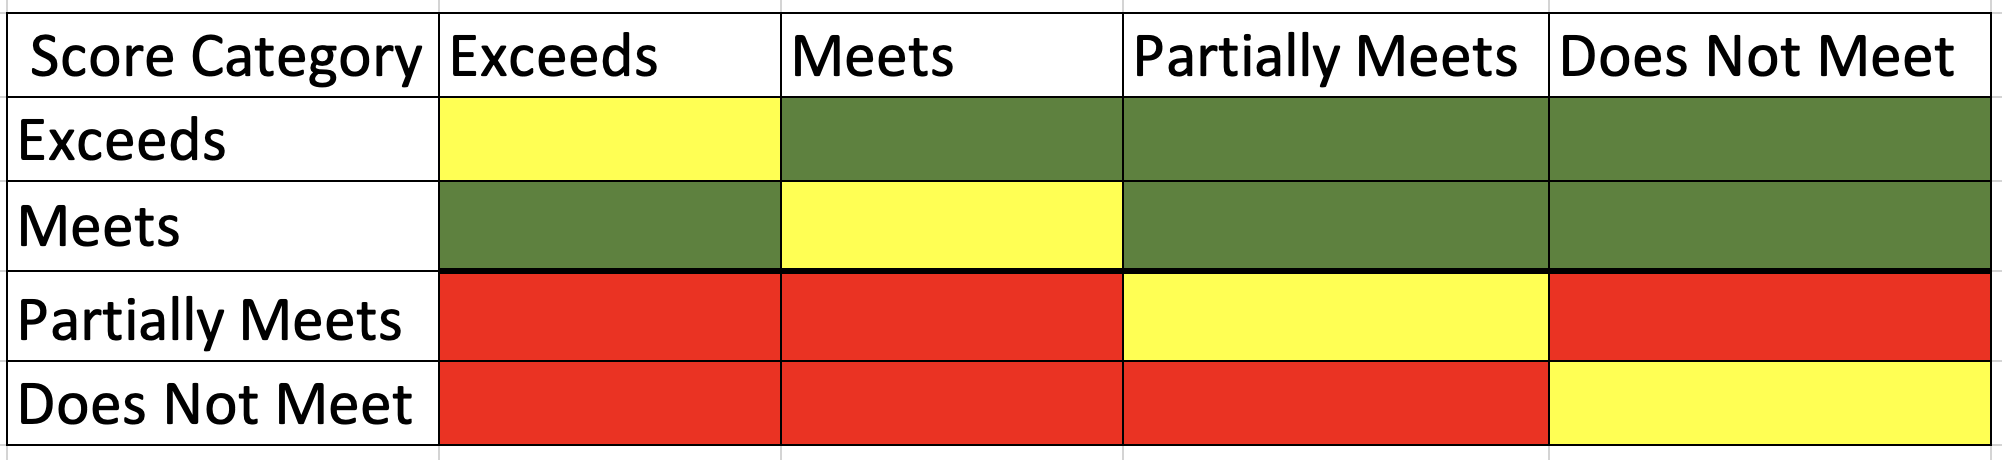
In my work as an instructional coach and later as a data coordinator for Burnsville, I discovered proficiency shift graphs. As a building leader, I want to build my annual goal coming what I learn from proficiency shifts with MCA and the assessments for reading and math such as the FAST suite. It is a strong visual representation of where your students have moved over time to determine how CORE instruction and how INTERVENTION instruction is having an effect.
Previous Assessment Scores
Current Assessment Scores
As you see in the chart above, a proficiency shift graph looks at the students who have taken an assessment in the former moment of time and the current time. This graph indicate a school year, like MCA testing or Fall to Fall or Spring to Spring Areading assessments. Based on the categories you can see who has moved from below proficiency to at or above proficiency or vice versa. Yellow boxes mean the student stayed in the same category--they stayed exceeding, meeting, close or needing support for proficiency.
This is especially important when as a leader you are determining if your CORE instruction is working. If it is not, you will see proficient students from a former time move FROM a green or yellow box to a red box. If a student has been below proficiency, you can see if they have moved UP from needing support or close to green boxes. If they are not, a principal can examine the interventions teachers have implemented for this group of students.